Weather Underground provides an extensive, easily searchable archive of historical temperature data. Unfortunately, the data, more often than not, contradicts itself. Try this:
- go to the main history search page
- enter the name of a city (select it from the autocomplete)
- hit submit
I'll use Rapid City, SD (weather station ID KRAP) as an example. After searching for a location, the page that loads includes record min and max temperatures for the selected date (unless you changed the date on the search page, it'll be the current day) in that city. Those records include the year they occurred. So far so good.
The URL for each page includes the date. To check the record, change the year in the URL to match that of the record. In my example, December 21 for Rapid City, SD, the max temperature occurred in 1991. Change the URL to 1991 and here's what loads:
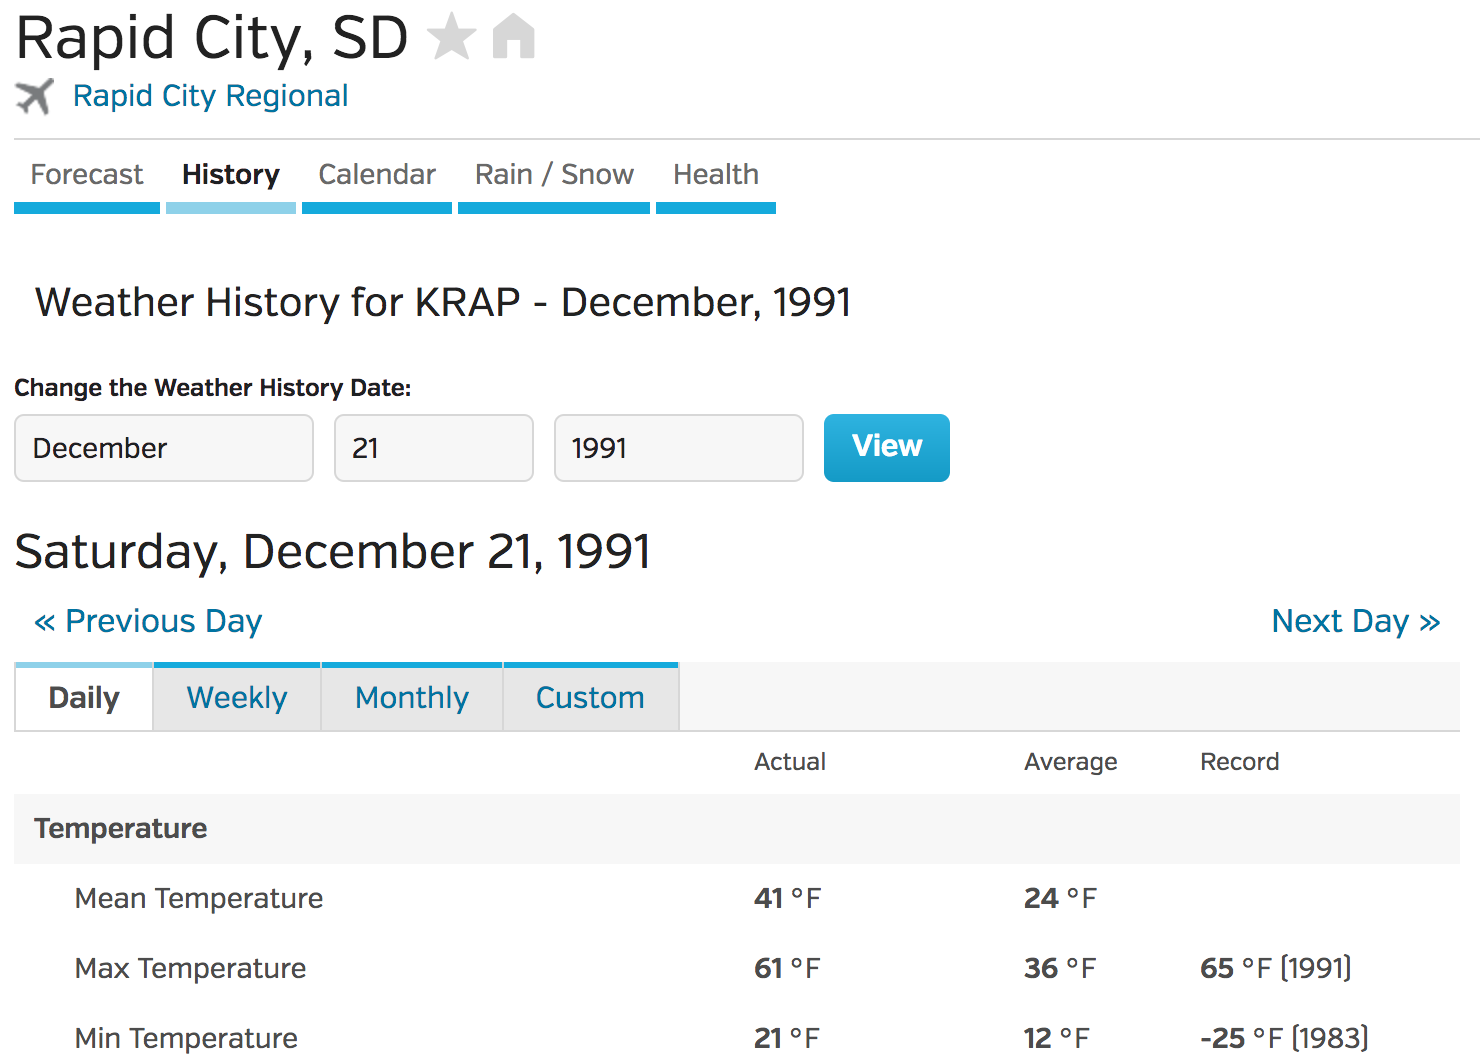
The record max temp was 65 but the actual was 61. These types of inconsistencies are everywhere in the Weather Underground data. Most discrepancies are smaller, usually 1-2 degrees (which, maybe are rounding errors?) but the sheer number of disagreements between actual and record values turned me off from using Weather Underground data. And I definitely didn't want to pay to use an API with this stuff as the backend.
Continuing with the Rapid City, SD example, here are more pages where there are errors that aren't easily explained:
- January 9, 1953, 8 degree difference in actual and record high
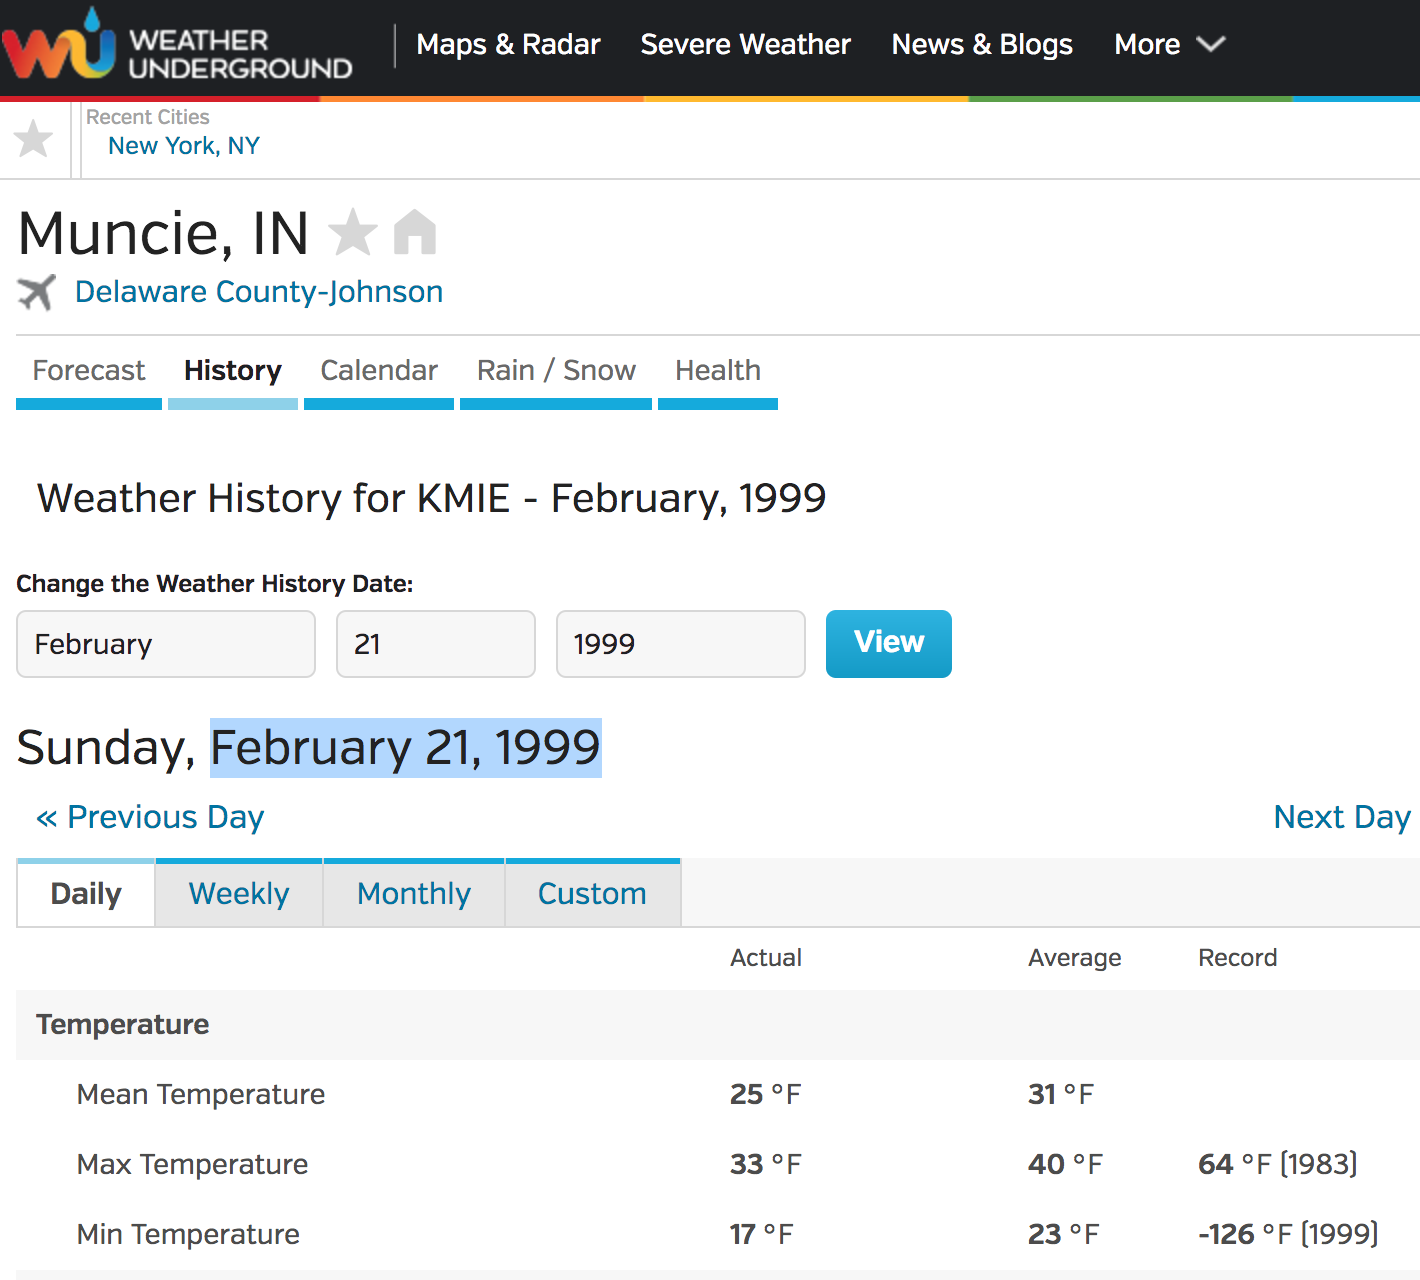
- February 24, 1955, 42 degree difference in actual and record high
- September 17, 1991, 8 degree difference in actual and record low
- December 8, 1972, 5 degree difference in actual and record low
I could go on but you get the picture.
I discovered this back at the beginning of the year when I wanted put together a simple site to explore record temperatures in an easy way. I ended up finding and using ThreadEx to build recordtemps.in. I sent a screen shot and a question to Weather Underground but heard nothing.
A little later I wrote some code to try to understand the magnitude of the disparities in the historic temperature data. That stuff is over on github if you want to explore for yourself. The README goes through the finer points but the high-level overview is:
- accept a weather station ID as an argument
- download all the pages for the station in question (one per day)
- pull out the "actual" and "record" min and max temperatures, as well as the year records occurred
- download all the pages for the date records occurred to get the "actual" and "record" min and max temperatures from that day
- write it all to a JSON file
- count number mismatches and matches in the data and find the days with the biggest gaps between "record" and "actual" values
- create a simple html page that displays a brief summary of the data for a single station and table with a row per day that shows mismatches as red.
The resulting tables always have a lot of red. I included these tables for ten places in the "display" folder in the github repo and a .csv with stats for the ten locations.
Another discovery: most places (nearly all that I checked) do not have "actual" values on August 24, 2000. I don't know what it is about that date but it's another point against using Weather Underground's data for anything other than a general ballpark of temperature extremes on a particular day.
Final fun discovery:
If anyone from Weather Underground wants to chat or correct me, please email me (link in the menu in the upper-right) or send me a tweet.